


How to Create Website Mockups People Actually Love
Learn how to create website mockups that bridge the gap between idea and reality. Our guide covers tools, principles, and developer handoff.
Build beautiful websites like these in minutes
Use Alpha to create, publish, and manage a fully functional website with ease.
So, what exactly is website analytics?
In the simplest terms, it’s the process of collecting and analyzing data about how people use your website. Think of it as a detailed report that tells you the complete story of every visitor, turning raw numbers into powerful business insights.
What Is Website Analytics Really

Picture your website as a brick-and-mortar store. Website analytics is your store manager, constantly observing what customers do. It tracks how many people walk through the door, which aisles they browse, what products they pick up, and—most importantly—how many actually make a purchase.
Instead of just counting heads, this process helps you understand the entire customer journey. By learning to interpret this data, you can finally stop guessing and start making smart, informed decisions. You’ll know precisely what’s working and what’s falling flat, which empowers you to improve the user experience, fine-tune your marketing, and hit your business goals.
Why This Story Matters
Getting a handle on visitor behavior is absolutely essential for any business with an online presence. This knowledge is what allows you to answer the most critical questions about your website's performance. For those in the B2B space, there are specific nuances to consider, and you can get a better grip by understanding B2B marketing analytics.
The market trends tell the same story. The global web analytics market was valued at around USD 6.67 billion in 2024 and is expected to explode to USD 24.79 billion by 2033. This shows just how vital data has become for modern business strategy.
To really nail this down, it helps to think about the core questions that website analytics is designed to answer. These five pillars form the bedrock of any solid analytics strategy, giving you a clear framework for making sense of all that data.
The Five Core Questions Website Analytics Answers
This table breaks down the fundamental insights you get from analytics, framing them as simple questions about your audience and their behavior.
Question | What It Means | Example Metric |
|---|---|---|
Who is visiting? | Understanding the demographic and geographic characteristics of your audience. | Location, Device Type |
How did they find you? | Identifying which channels are driving traffic to your website. | Traffic Source (e.g., Organic, Social) |
What do they do? | Analyzing how visitors interact with your pages and content. | Pages per Session, Bounce Rate |
Are they converting? | Measuring whether visitors are completing desired actions. | Conversion Rate (e.g., Form Submission) |
Why do they leave? | Pinpointing where visitors drop off in their journey. | Exit Pages |
By consistently asking and answering these questions with your data, you move from just having a website to truly understanding your online business.
Why Analytics Is Your Website's Most Important Tool
Ever tried to drive in a foreign country without a map or GPS? You might stumble upon your destination eventually, but you'll probably take a lot of wrong turns and waste a ton of gas. Running a website without analytics is exactly like that. It's guesswork. Analytics is your digital GPS, giving you clear, data-driven directions to get where you want to go.
For any business, whether you're a local coffee shop or a global software company, analytics is what turns gut feelings into a real strategy. It helps you stop asking, “What do we think we should do?” and start saying, “Here’s what the data proves we should do next.”
Understand Who Your Visitors Really Are
The people visiting your website aren't just faceless numbers on a dashboard; they're potential customers, loyal readers, and future clients. Analytics helps you get to know them on a much deeper level. You can see which articles they read to the end, what products they keep coming back to look at, and the exact journey they take from your homepage to the checkout.
Let's say you run an online clothing store. You notice a blog post about "Styling a Denim Jacket" is getting a huge amount of traffic month after month. That's not a coincidence; it's your audience telling you exactly what they're interested in. Armed with that knowledge, you could feature denim jackets on your homepage, create a targeted ad campaign around them, and see your sales climb—all because you paid attention to the story your data was telling.
Website analytics bridges the gap between what you assume your audience wants and what their actions prove they want. It replaces assumptions with cold, hard evidence.
Find and Fix the Hidden Problems
Are potential customers vanishing from your site on a specific page? Is your shopping cart full of abandoned items? Analytics shines a bright light on these friction points—the little annoyances in your user experience that are quietly killing your conversions.
A slow-loading page, for instance, is a classic conversion killer. People just don't have the patience for it. Your analytics can show you which pages have a high exit rate, a dead giveaway that something is wrong. Once you've identified these problem spots, you can take action. If you suspect speed is the culprit, learning how to improve website loading speed is a fantastic starting point.
Without this data, these issues are invisible. They just sit there, silently chipping away at your website's performance.
Measure What's Actually Working
At the end of the day, you need to know if your marketing efforts are paying off. Analytics gives you the definitive answer. It shows you precisely which channels—whether it's your SEO efforts, your paid social media ads, or your weekly newsletter—are bringing in the most engaged and valuable traffic.
This allows you to make smarter decisions across the board:
Allocate Your Budget Wisely: Why spend money on channels that don't deliver? Put your resources into what has a proven return on investment (ROI).
Refine Your Campaigns: See a particular ad or piece of content knocking it out of the park? Double down on that approach.
Prove Your Worth: Show your boss or your clients exactly how your marketing is moving the needle with clear, undeniable numbers.
Simply put, analytics is the engine of improvement. It ensures every single decision is backed by data, focused on your goals, and designed for real, measurable growth.
Learning the Language of Your Data
Diving into your website analytics dashboard for the first time can feel like you've been handed a pilot's manual for a 747. You're hit with a wall of charts, graphs, and jargon that just doesn't seem to make sense. But here's the thing: once you learn the vocabulary, you start to see the incredible stories your data is telling you.
That's where the magic of analytics really kicks in. It’s not about memorizing textbook definitions. It’s about understanding what each number actually reveals about your visitors and the journey they take on your site. Let’s start decoding some of the most common terms you'll see.
Core Metrics Every Website Owner Should Know
Think of these as the basic building blocks of your data's language. Get these down, and you're well on your way to understanding the bigger picture.
Users: This is simply the number of unique individuals who visited your website. Picture a local coffee shop—a user is one specific person, no matter how many times they pop in for a latte that week.
Sessions: A session is a single, continuous visit to your website. If that one coffee lover visits on Monday, again on Wednesday, and once more on Friday, that counts as one user but three separate sessions. Most analytics tools end a session after 30 minutes of inactivity.
Pageviews: This metric tracks the total number of pages viewed. If our coffee shop patron looks at the menu, the "About Us" page, and the contact page during one visit, that single session just generated three pageviews.
This infographic breaks down how understanding your audience through these metrics feeds directly into a smarter strategy that actually grows your business.
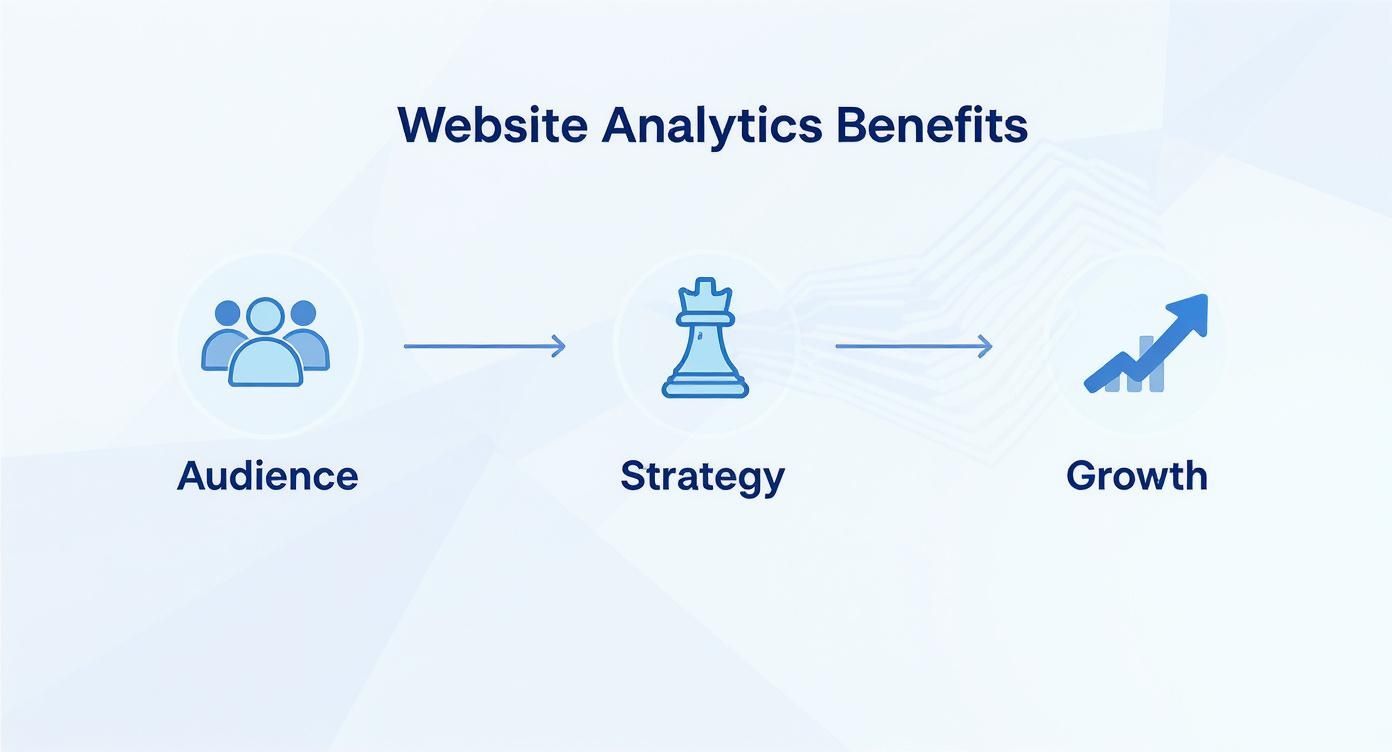
As you can see, every piece of information you gather about your audience helps you refine your approach, which in turn leads to real, measurable results.
Metrics That Reveal User Engagement
Beyond just counting heads and clicks, some metrics tell you how captivating your content really is. These are vital for judging the quality of your traffic and figuring out what’s working—and what isn’t.
Bounce Rate is a big one. This is the percentage of visitors who land on one of your pages and then leave without doing anything else. No clicks, no form fills, no scrolling. It's the digital equivalent of someone walking into your store, taking a quick glance around, and immediately turning around to leave. A high bounce rate could mean your landing page wasn't what they expected, or maybe it was just too slow to load.
What’s a "good" bounce rate? It really depends. For a blog post where someone might find an answer and leave, a bounce rate between 65-90% can be perfectly normal. But for a homepage, you’d want to see a much lower number, ideally in the 25-45% range.
Another crucial one is Conversion Rate. This is the percentage of your visitors who complete a goal you’ve set, whether that’s buying a product, signing up for your newsletter, or filling out a contact form. This is the ultimate test—is your website actually getting people to take the action you want them to take?
By piecing these metrics together, you can start building a clear picture of what's happening on your site. To go deeper on applying these ideas, take a look at our guide on how to analyze website traffic. Learning this language is the key to turning raw data into your most powerful tool for growth.
Choosing the Right Analytics Platform
So, you're sold on the "why" of website analytics. The next question is, what tool do you actually use?
Think of it like picking a vehicle for a road trip. A zippy little car is great for navigating a city, but you'd want a heavy-duty RV for a cross-country adventure with the whole family. The right analytics platform really depends on where you're trying to go with your business.
For most people just starting out—from bloggers and solopreneurs to small businesses—the road almost always begins with Google Analytics. It's the industry standard for a reason. It’s incredibly powerful, plugs into just about every other marketing tool you can think of, and, best of all, the standard version is completely free.
Its market dominance is hard to overstate. In 2025, an estimated 55.49% of all websites are running Google Analytics, and its products command a huge slice of the global web analytics market. You can dig into more of these stats over at Narrative.bi. This massive user base is actually a huge plus, as it means there’s a giant community and endless free tutorials out there to help you get started.
Exploring the Top Options
While Google Analytics is the most popular kid on the block, it's definitely not the only one. Other platforms have carved out a niche by focusing on specific needs, like enhanced data privacy or features built for massive companies.
Here are a couple of popular alternatives:
Matomo (formerly Piwik): If data privacy is your top concern, Matomo is your best bet. It’s an open-source platform, which gives you the option to host it on your own servers. This means you have 100% data ownership and an easier path to complying with strict regulations like GDPR.
Adobe Analytics: This is the big-league option. As part of Adobe's massive suite of marketing tools, Adobe Analytics is built for large corporations that need incredibly deep customization, predictive analysis, and the ability to slice and dice data in ways most other tools can't.
These aren't just clones of Google Analytics; they serve very different, and very important, purposes.
Comparing Popular Website Analytics Platforms
A high-level comparison of the leading analytics tools to help you choose the best fit for your website's goals and resources.
Choosing the right platform isn't about getting the one with the longest feature list. It's about finding the tool that gives you clear, actionable insights for your specific business goals.
The goal is to find the platform that delivers the clearest insights for your business. Don’t pay for an RV if all you really need is a reliable sedan to get you around town.
To help you see the differences at a glance, here’s a quick breakdown of how the big players stack up. This should help you figure out which tool is the best match for your budget, team, and technical skills.
Platform | Best For | Pricing Model | Key Feature |
|---|---|---|---|
Google Analytics | Beginners, SMBs, Marketers | Freemium | Deep integration with Google Ads & Search Console |
Matomo | Privacy-Focused Businesses | Free (Self-Hosted) / Paid (Cloud) | 100% data ownership and no data sampling |
Adobe Analytics | Large Enterprises & Corporations | Subscription (High-End) | Advanced segmentation and predictive analytics |
At the end of the day, a huge part of understanding website analytics is simply picking the right instrument to measure what matters. For most businesses, Google Analytics is the perfect place to start that journey.
Turning Your Data Into Action
Collecting data is one thing, but the real magic happens when you use it to make smart decisions. Think of your analytics as a collection of clues. Your job is to step into the role of a detective, piecing together those clues to solve the puzzle of what your audience really wants.
This is where numbers on a screen become real-world strategy. A high bounce rate isn't just a percentage; it's a story about visitors not finding what they expected. Connecting these dots is the difference between knowing how many cars drive past your store and knowing exactly what convinces them to pull over and come inside.
Let's look at a couple of real-world scenarios to see how this works.
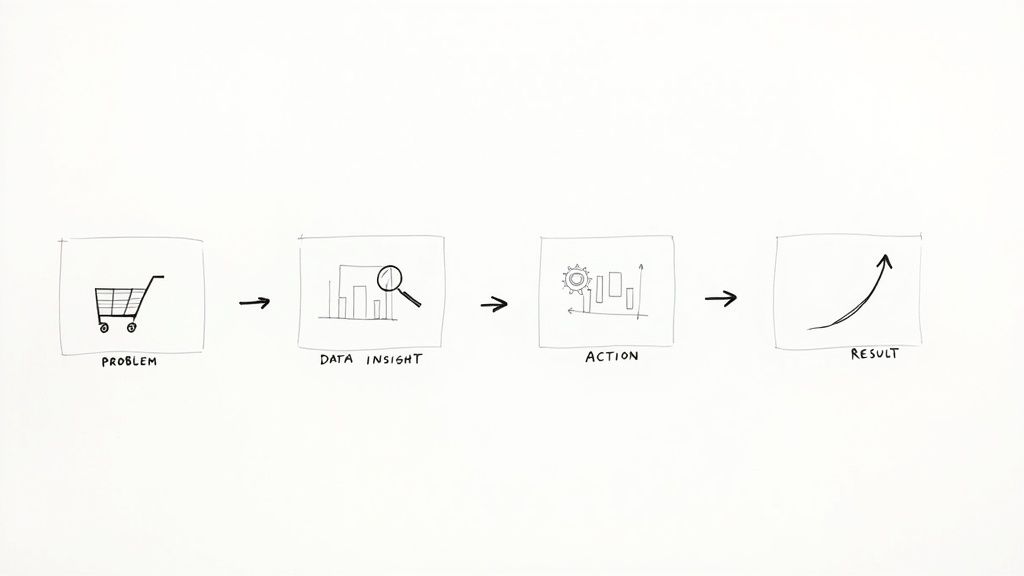
Example 1: The E-commerce Store with Abandoned Carts
Imagine an online shop that sells custom phone cases. They have a ton of traffic, and people are adding products to their carts like crazy. The problem? Most of them disappear before ever hitting the "buy" button.
The Problem: A painfully high shopping cart abandonment rate.
The Data Insight: They dig into their analytics and look at the user flow report. A clear pattern emerges: a staggering 75% of users are bailing on the shipping information page. That’s a massive red flag.
The Action: The owner suspects surprise shipping costs are the culprit. To test this theory, they run an A/B test, adding a simple shipping cost calculator right on the product pages. No more sticker shock at the end.
The Result: Almost immediately, cart abandonment drops by 30%. By being upfront and transparent, they built trust and removed the friction that was costing them sales.
Example 2: The Blogger with Stagnant Traffic
Now, think about a food blogger who pours their heart into creating amazing recipes. The content is top-notch, but their audience growth has completely flatlined. They feel like they're shouting into the void.
The Problem: Monthly traffic growth has stalled out.
The Data Insight: Frustrated, she dives into her Traffic Sources report. She’s been putting all her energy into Instagram, but the data tells a different story. A whopping 60% of her new visitors are coming from Pinterest.
The Action: The data gave her a clear signal. She immediately pivots, creating beautiful, "pinnable" images for every recipe and spending more time engaging with the Pinterest community.
The Result: Within two months, her traffic from Pinterest doubles, pushing her overall site traffic up by 45%. She stopped guessing and started following the trail her audience had already left for her.
Insights from your website analytics are your best guide for where to invest your time and resources. They point you directly to the opportunities with the highest potential for impact.
These stories show that analytics isn't about looking in the rearview mirror; it's about steering your website toward a better future. By finding the friction points and leaning into what’s already working, you can make focused changes that deliver real results.
This is just the start. These principles are the foundation for bigger wins, and you can explore more advanced techniques through effective conversion rate optimization strategies to get even more out of your traffic. Every number is a breadcrumb leading to a potential improvement.
Answering Your Top Website Analytics Questions
Diving into website analytics for the first time usually brings up a handful of practical questions. It's totally normal. Getting these sorted out from the start will give you the confidence to build a strategy that actually works. Let's walk through some of the most common things beginners wonder about.
How Long Should I Wait Before I Trust the Data?
Your analytics tool starts tracking the moment it's set up, but hold off on making any big decisions right away. It's best to let the data collect for at least 30 days.
Why? A single day's traffic spike or dip can be a fluke. A month's worth of data, however, gives you a much clearer picture of real trends and user behavior.
If your business is seasonal—say, you sell swimwear—you'll want to compare your data year-over-year. This is the only way to know if you're actually growing or just riding the predictable summer wave.
Is Website Analytics Too Complicated for a Beginner?
Absolutely not. It might seem intimidating with all the graphs and charts, but the basics are surprisingly straightforward. Modern tools like Google Analytics are built with user-friendly dashboards and even offer automated insights to point you in the right direction.
The trick is to not boil the ocean. Don't try to learn every single metric on day one.
Start with a single, simple goal. For instance, find your top five most-visited pages, or figure out which social media platform sends you the most traffic. Tackling one thing at a time keeps you from feeling overwhelmed and helps you score some quick, motivating wins.
How Do Analytics and SEO Fit Together?
Think of them as two sides of the same coin; they’re completely intertwined. SEO is all the work you do to get people to your site from search engines. Analytics is how you measure if any of that work is actually paying off.
It breaks down like this:
SEO is your strategy: You write blog posts, optimize your pages, and build links.
Analytics is your report card: It tells you exactly how well that strategy is performing.
Analytics shows you which keywords are bringing people in, which pages keep them engaged, and whether all that traffic is turning into actual customers. Without this feedback, you're just guessing with your SEO.
Can I Use More Than One Analytics Tool?
You can, but I wouldn't recommend it when you're just starting out. Each analytics tool adds a bit of code to your site, and running several at once can slow your pages down. A slow website is bad for visitors and can even hurt your search rankings.
Plus, different tools sometimes track metrics in slightly different ways, which can lead to conflicting numbers and a whole lot of confusion.
It’s much smarter to pick one primary tool and really master it. Once you feel comfortable pulling reports and understanding what they mean, you can look into adding specialized tools for things like heatmaps or user recordings to get even deeper insights.
Ready to stop guessing and start building a website that truly connects with your audience? With Alpha, you can create a beautiful, professional website in hours, not weeks. Our AI-powered platform makes design intuitive, and with built-in analytics, you'll have the data you need to grow from day one. Start building your site with Alpha.
Build beautiful websites like these in minutes
Use Alpha to create, publish, and manage a fully functional website with ease.